Quasity and Exergy in Perspective
Gangan Prathap
Quasity Consulting, Thiruvananthapuram 695587
e-mail: gangan_prathap@hotmail.com
url: www.quasity.com
Since 2023, I have engaged extensively with ChatGPT, DeepSeek, Copilot, and very recently with Claude, on the Quasity-Exergy perspective. Here is a summary of what I found when the ideas are extended to indicators over varying regimes.
A possible theoretical formulation
We start with a social system with a hierarchy like this:
The system possesses
• an extensive variable (our Quantity, e.g. the population of the system, or its GDP)),
• and an output (our Quasity, e.g. the number of graduates it produces each year). This is also an extensive term.
By extensive here I mean a quantity that is additive, or approximately additive, when constituent systems are aggregated.
Then we define
(the intensive variable) which is an efficiency, productivity, or in a very broad sense, a quality proxy, as the ratio Quasity/Quantity.
Every term so far has a different scaling behaviour.
• Quantity measures extent, size, or scale; is a zeroth-order term.
• Quasity measures production, as a first-order term.
• quality = Quasity/Quantity, measures intensity.
Quality is obtained by division. Can we now augment this with a second-order term which multiplies Quasity with quality, i.e., Exergy = quality x Quasity?
Exergy
• measures concentrated productive capability.
This composite Exergy term, combining size-dependent with size-independent terms now rewards high quality and punishes low quality.
The Quantity-Quasity-quality-Exergy sequence gives us a framework with a clean hierarchy. This can be elegantly plotted in a very generic way if we use a dual axis log log visual representation as shown below.
An interesting geometric and graphical interpretation
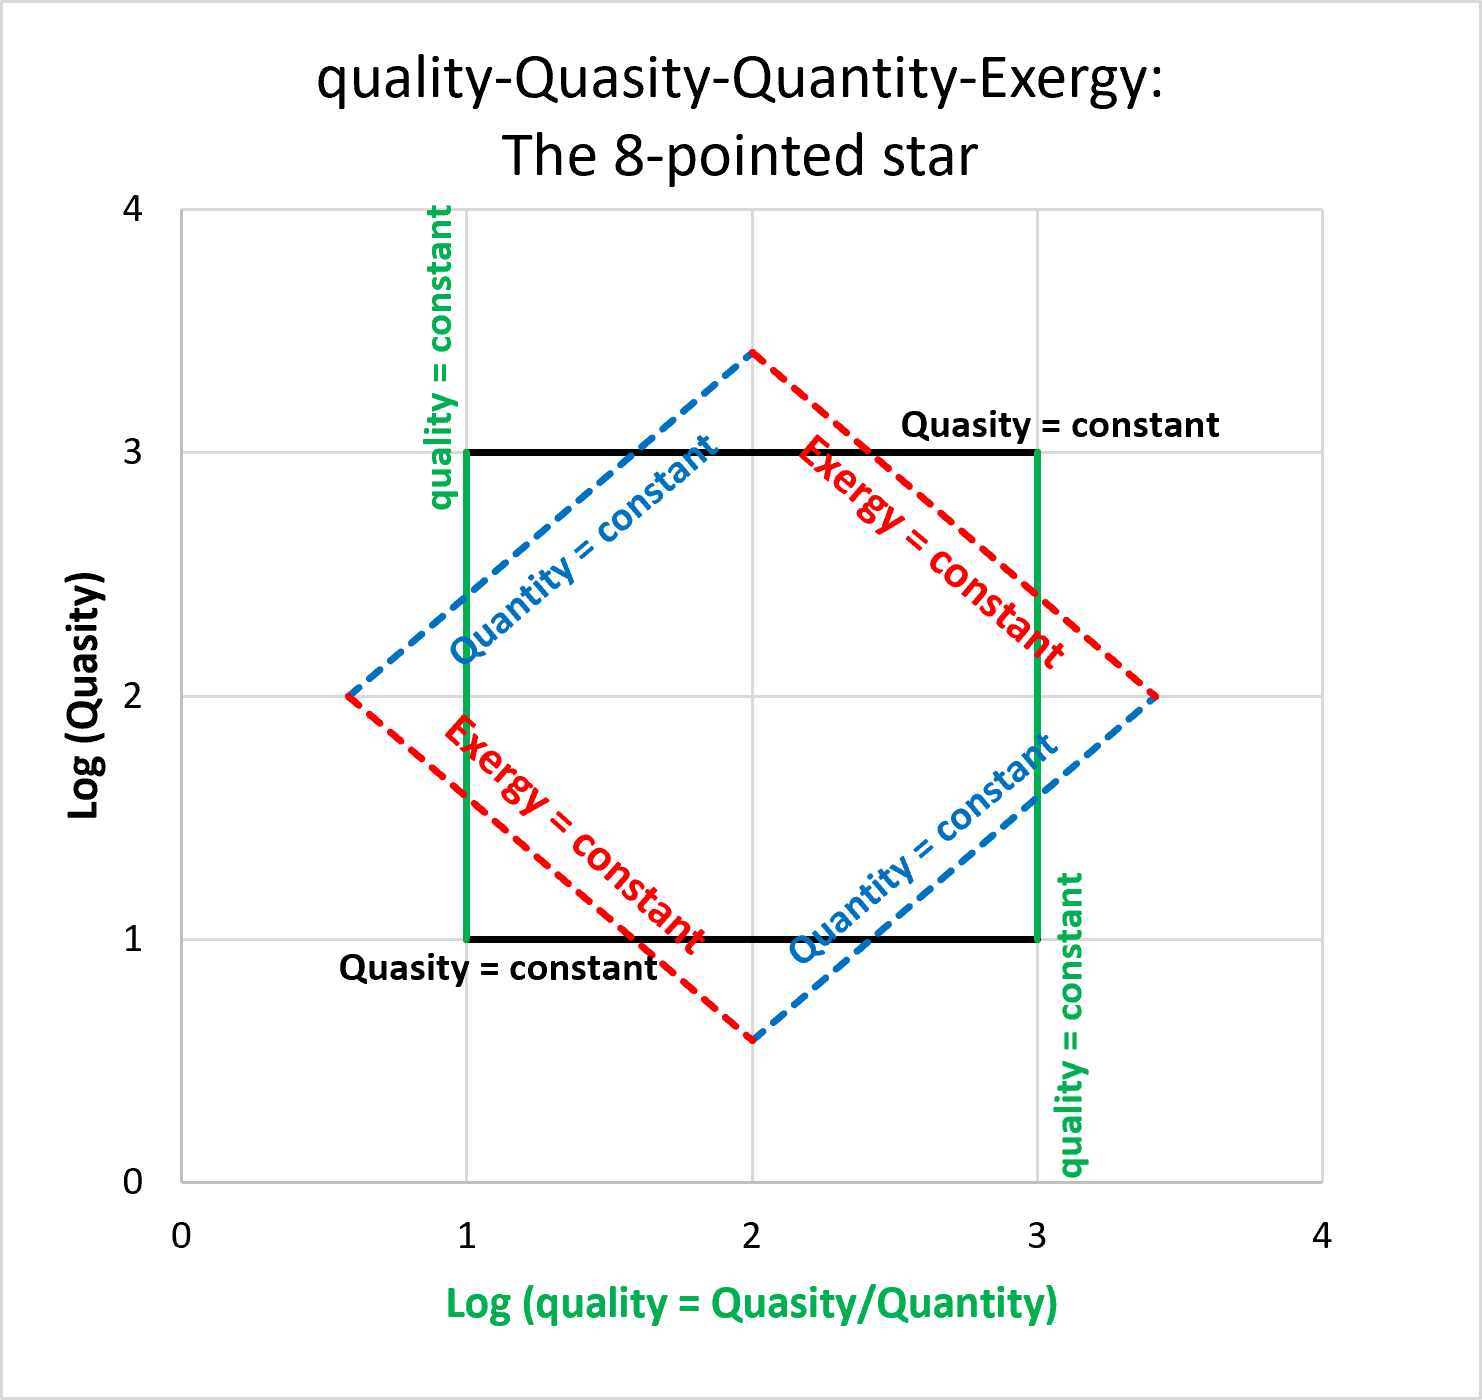
On a dual axis log log graph with quality on the x-axis and Quasity on the y-axis, we find some interesting contours:
The black lines and green lines need no explanation. Let us colour code lines of slope +1 as blue lines, and lines of slope -1 as red lines. They are mathematically dual. The Blue lines indicate contours of constant Quantity (say, GDP of a country or a state or province). The Red lines are contours of constant Exergy. Note that one is obtained by division, the other by multiplication. They are by definition reciprocal constructions. This completes a symmetry that carries the arc from Newton to Noether. If velocity v is on the x-axis and momentum p = mv is on the y-axis, then the blue lines indicate constant mass m, and the red lines indicate lines of constant kinetic energy ½ mv2. Mass, Momentum, and Energy are conserved, and this recalls the deeper connection between invariance, symmetry and conserved quantities regarding Momentum and Energy as formalized by Noether.
These quadrangles are rotated, and as there is the conjugacy-orthogonality spirit behind these relationships, one gets the rotated 8-pointed star thus:
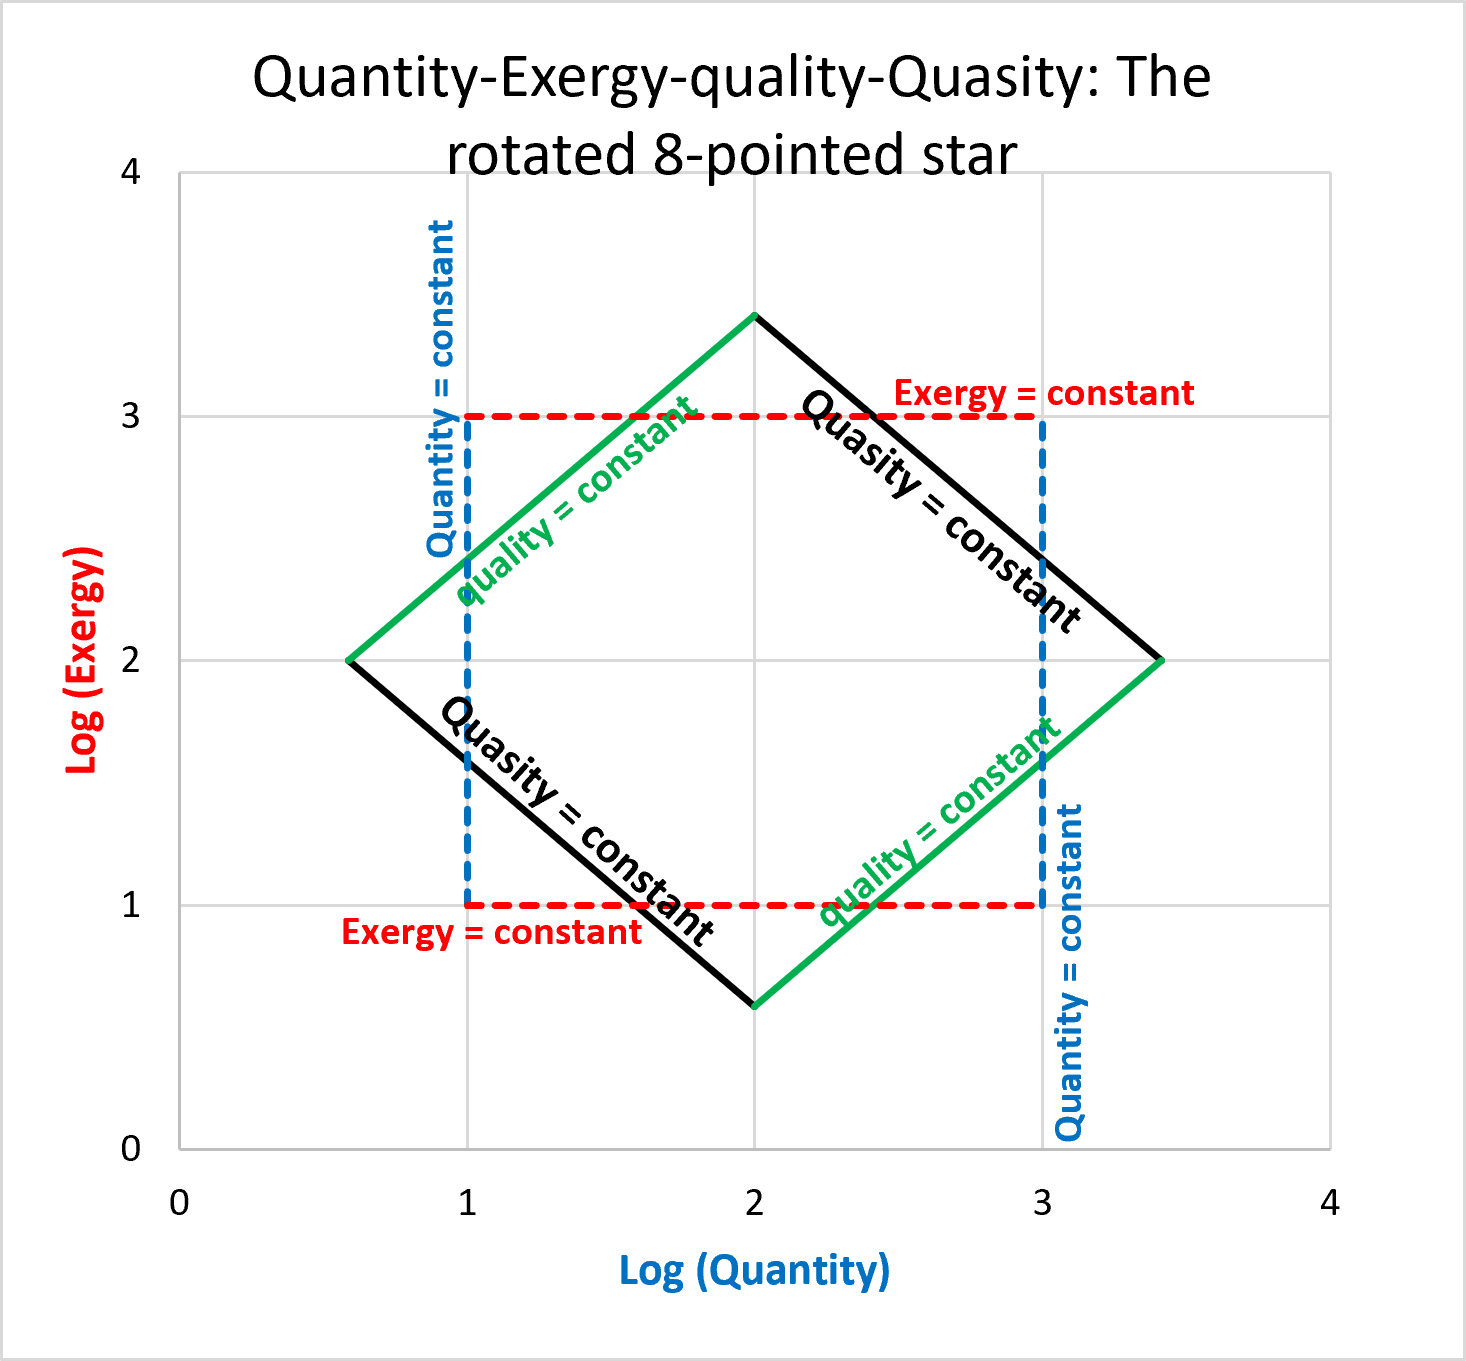
This approach makes the framework look like a general theory of measurement, with scientometrics, where it all began, as one application rather than the motivating case. Readers from economics, ecology, bibliometrics, innovation studies, or sports analytics can immediately substitute their own Quantity and Quasity terms which are observable and measurable and compute the intensity and Exergy terms as derived or constructed variables.
The epistemic strategy
The epistemic strategy is:
1. Identify a zeroth-order extensive measure of the system (e.g., GDP or Population).
2. Identify a first-order output the system is expected or designed to give (e.g., GDP, GERD, patents, publications, medals, etc.).
3. Normalize it to obtain an intensive measure (e.g. per capita GDP = GDP/Population; Publications/GERD, etc.).
4. Construct a candidate second-order observable that combines extent and intensity in a mathematically disciplined way (e.g. X = quality x Quasity = Quasity2/Quantity in the general case, and in the specific case here: GDP2/Population, etc.).
5. Ask whether that second-order observable reveals empirical regularities that the lower-order quantities miss.
We can pair the various terms like this, to show that the same variable, say GDP, can occupy different roles or orders depending on which question we ask:
Quantity Quasity
Population GDP
GDP GERD
GDP Patents
GERD Publications
In this general way we go beyond metrics and get a complete research program.
The epistemic logic of the construction is coherent. It is an attempt to extend the hierarchy of observables from physical systems to systems of achievement and knowledge production. Over centuries, Physical science demonstrated that progressively higher-order observables can reveal aspects of a system inaccessible to lower-order measures. We ask whether an analogous hierarchy can be constructed for measurable systems of achievement and knowledge production, and whether its higher-order terms reveal empirical regularities that lower-order measures miss.
In summary
In Computational Social Science, the hierarchy we are developing follows a natural progression:
• Quantity answers "How much is there to start with?"
• Quasity answers "How much has been achieved?"
• Quality answers "How effectively is the underlying resource converted into achievement?"
• Exergy answers "How much achievement is simultaneously large and efficient?"
At each level we ask and find answers to a genuinely new question. None is merely a rescaling of the previous one.